Authors: Dr Liang Chen1, Dr Todd Blackburn1, Dr Daniela-Lee Smith1, Dr Veronica Cashin1, Dr Jarrod Sandow1
Affiliations: 1IonOpticks, Collingwood, Australia.
Keywords: NanoShield, C18, trap column, Aurora, IonOpticks, Thermo Scientific, Bruker, UHPLC system, nanoElute 2, reversed-phase, direct injection, hydrophilic, FWHM, identifications, DIA, DDA, bottom-up, sample clean-up, timsTOF HT, Orbitrap, Fusion, Lumos, high-throughput, trap-elute, reversed-flush.

INTRODUCTION
Chromatographic trap columns are essential in proteomic UHPLC–MS workflows, improving analyte focusing and enabling rapid sample loading with in-line sample clean-up to protect analytical columns from blockages and contamination while reducing ion suppression. These benefits extend column lifetime and reduce maintenance, supporting robust, high-throughput, and reproducible proteomic analyses. Despite these advantages, trap columns traditionally sacrifice peptide and protein identifications compared to direct injection.
The NanoShield™ C18 5 cm × 100 μm trap column minimises this trade-off, delivering near-direct injection performance with only minimal losses while providing superior peptide identifications, peak quality, and hydrophilic peptide coverage compared to other trap columns.
A perfectly paired trap for Aurora Series columns
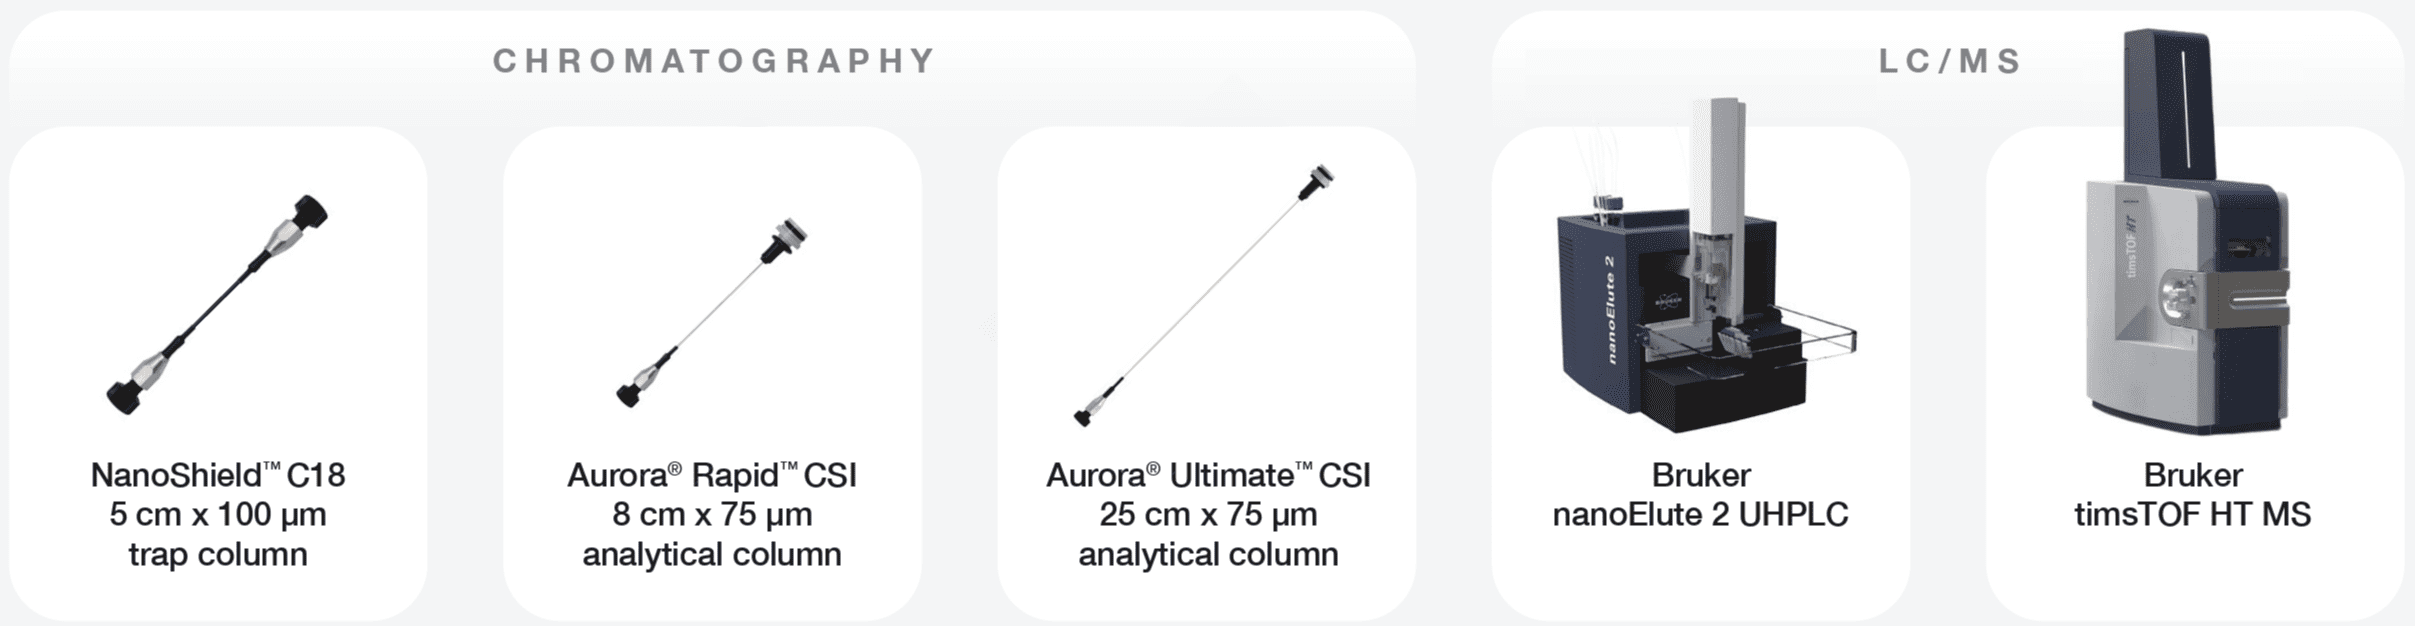
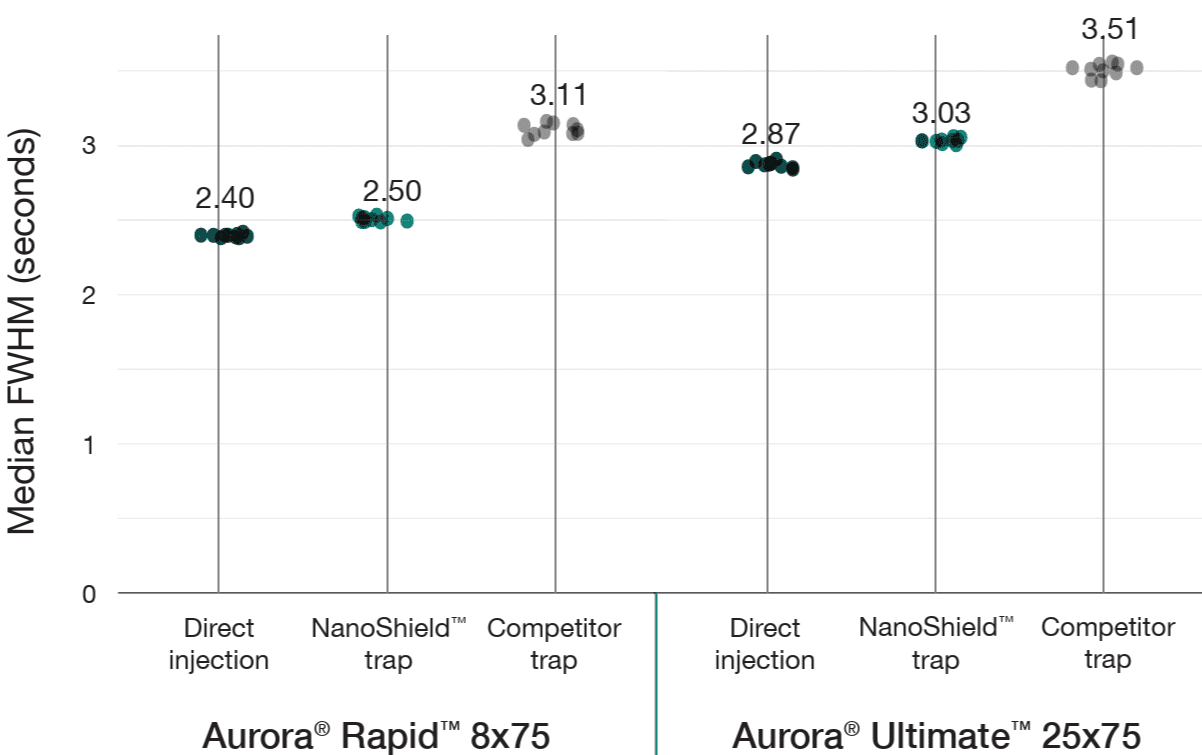
A 100 ng HeLa tryptic digest was analysed using a reverse-flush trap-elute method compared to direct injection across two workflows: a 37-minute gradient on the Aurora® Ultimate™ CSI (25 cm x 75 μm) column and a 14-minute gradient on the Aurora® Rapid™ CSI (8 cm × 75 μm) column, both analysed on a Bruker nanoElute 2 UHPLC coupled to a Bruker timsTOF HT mass spectrometer. The NanoShield™ trap column (5 cm x 100 μm, 3 μm C18 particles) demonstrated near-direct injection performance across all metrics while substantially outperforming the comeptitor trap cartridge (5 mm x 300 μm, 5 μm C18 particles). NanoShield™ showed less than 1% reduction in protein identifications and a 1–3% reduction in precursor identifications compared to direct injection across both columns (Figure 1). Peak quality metrics remained similarly robust, with marginal increases in FWHM and minimal changes to peak shape ratios compared to direct injection, while maintaining significantly superior performance relative to the competitor trap cartridge (Figure 2).
Precursors comparison across columns
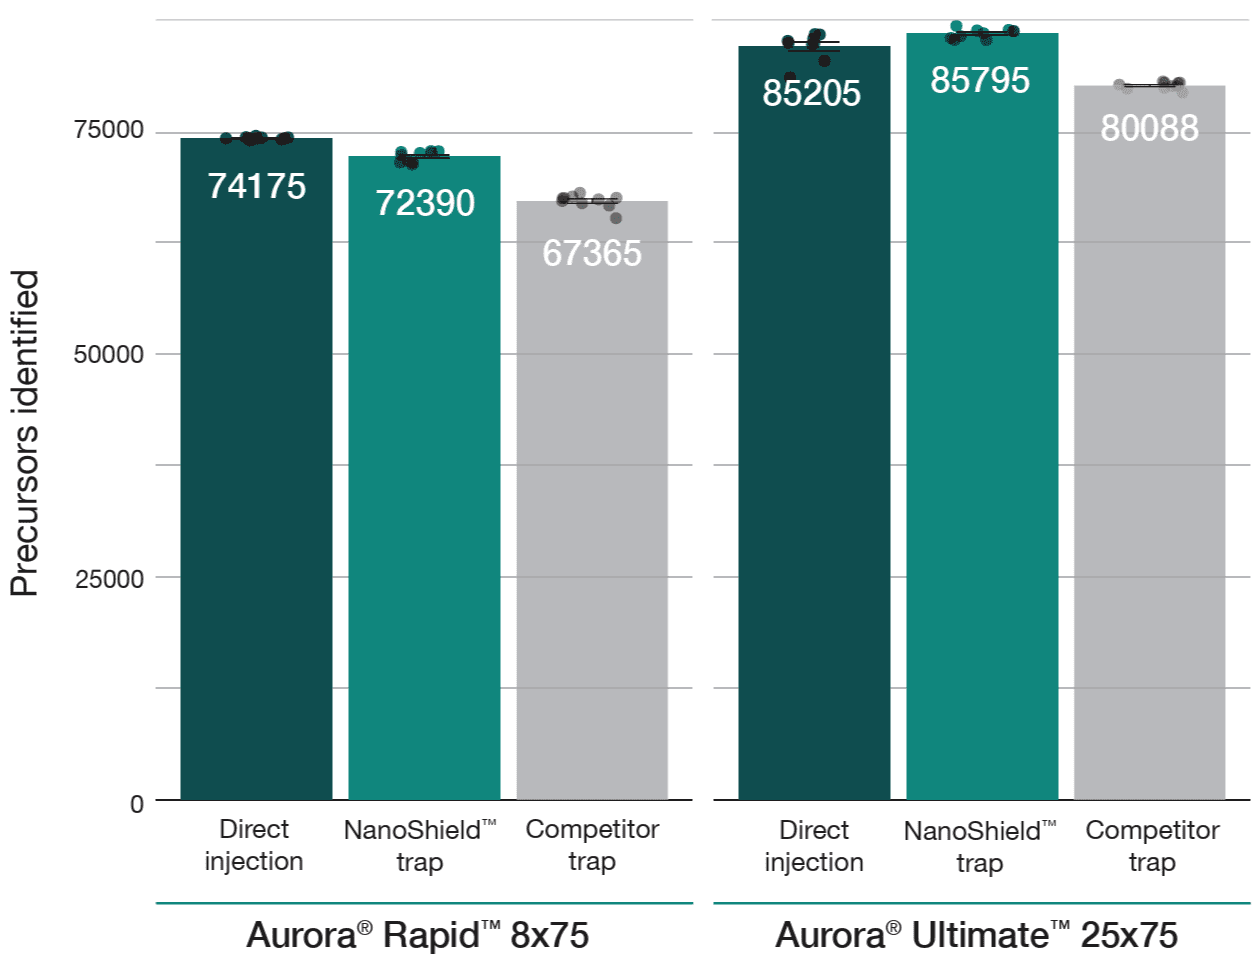
Unique proteins comparison across columns
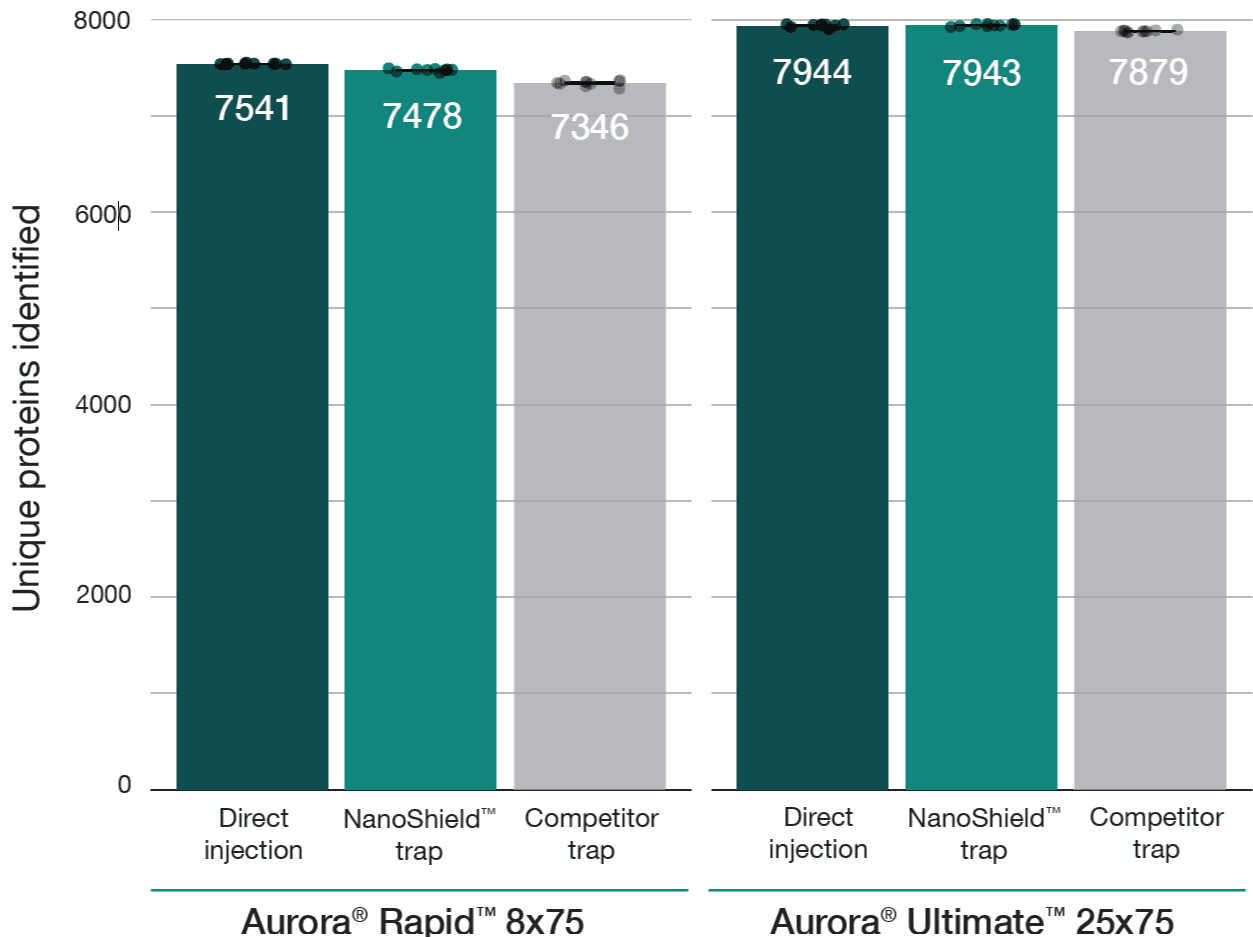
Figure 1: NanoShield™ maintains near-direct injection identification rates across column formats. Precursor and unique protein identifications from 100 ng HeLa digest comparing direct injection, the 5 cm NanoShield™ trap column, and a competitor C18 trap cartridge on an Aurora® Rapid™ 8 cm × 75 μm column (14-min gradient) and an Aurora® Ultimate™ 25 cm x 75 μm column (37-min gradient). Data analysed with Spectronaut 20.2. Each dot represents the analysis of an independent sample injection.
Median FWHM comparison across columns
Median peak ratio comparison across columns
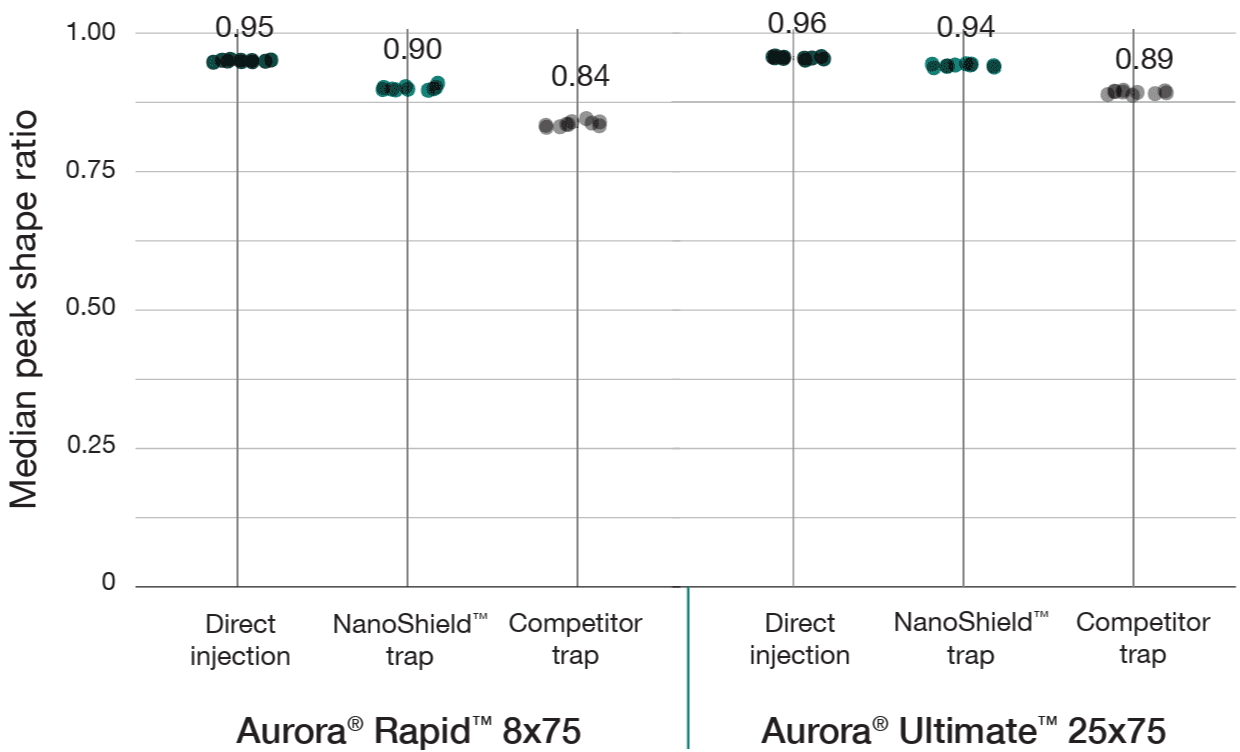
Figure 2: NanoShield™ preserves peak quality with minimal performance loss. FWHM and peak shape ratio comparisons for direct injection, NanoShield™ trap, and a competitor C18 trap cartridge on an Aurora® Rapid™ 8 cm × 75 μm column (14-min gradient) and an Aurora® Ultimate™ 25 cm x 75 μm column (37-min gradient). Data analysed with Spectronaut 20.2. Each dot represents the analysis of an independent sample injection.
Superior peptide retention
One disadvantage of using traditional trap columns is the risk of losing hydrophilic peptides during sample loading. Early-eluting peptides such as post-translationally modified peptides (e.g., phosphopeptides and glycopeptides), which are typically more hydrophilic, can pass through traditional traps during the sample loading and clean-up steps, creating gaps in proteome coverage and reducing overall identifications. This hydrophilic peptide loss represents a significant compromise compared to the comprehensive analysis achieved with direct injection workflows. The NanoShield™ C18 trap eliminates this barrier, delivering direct injection-level proteome coverage and identifications as demonstrated above.
To quantify peptide retention across the gradient, a reference set of 100 peptides equally distributed by retention time was selected from the Aurora® Ultimate™ 25 cm × 75 μm direct injection analysis. Only high-abundance peptides (top 25% intensity) were selected to ensure reliable detection. These peptides were then tracked across both the NanoShield™ and a competitor C18 trap cartridge . The competitor trap cartridge failed to retain the majority of early-eluting peptides, while the NanoShield™ successfully captured all 100 peptides observed in direct injection (Figure 3). Additionally, the NanoShield™ demonstrated stable retention times across multiple injections, ensuring reproducible peptide elution profiles (Figure 4).
Peptide retention across gradient
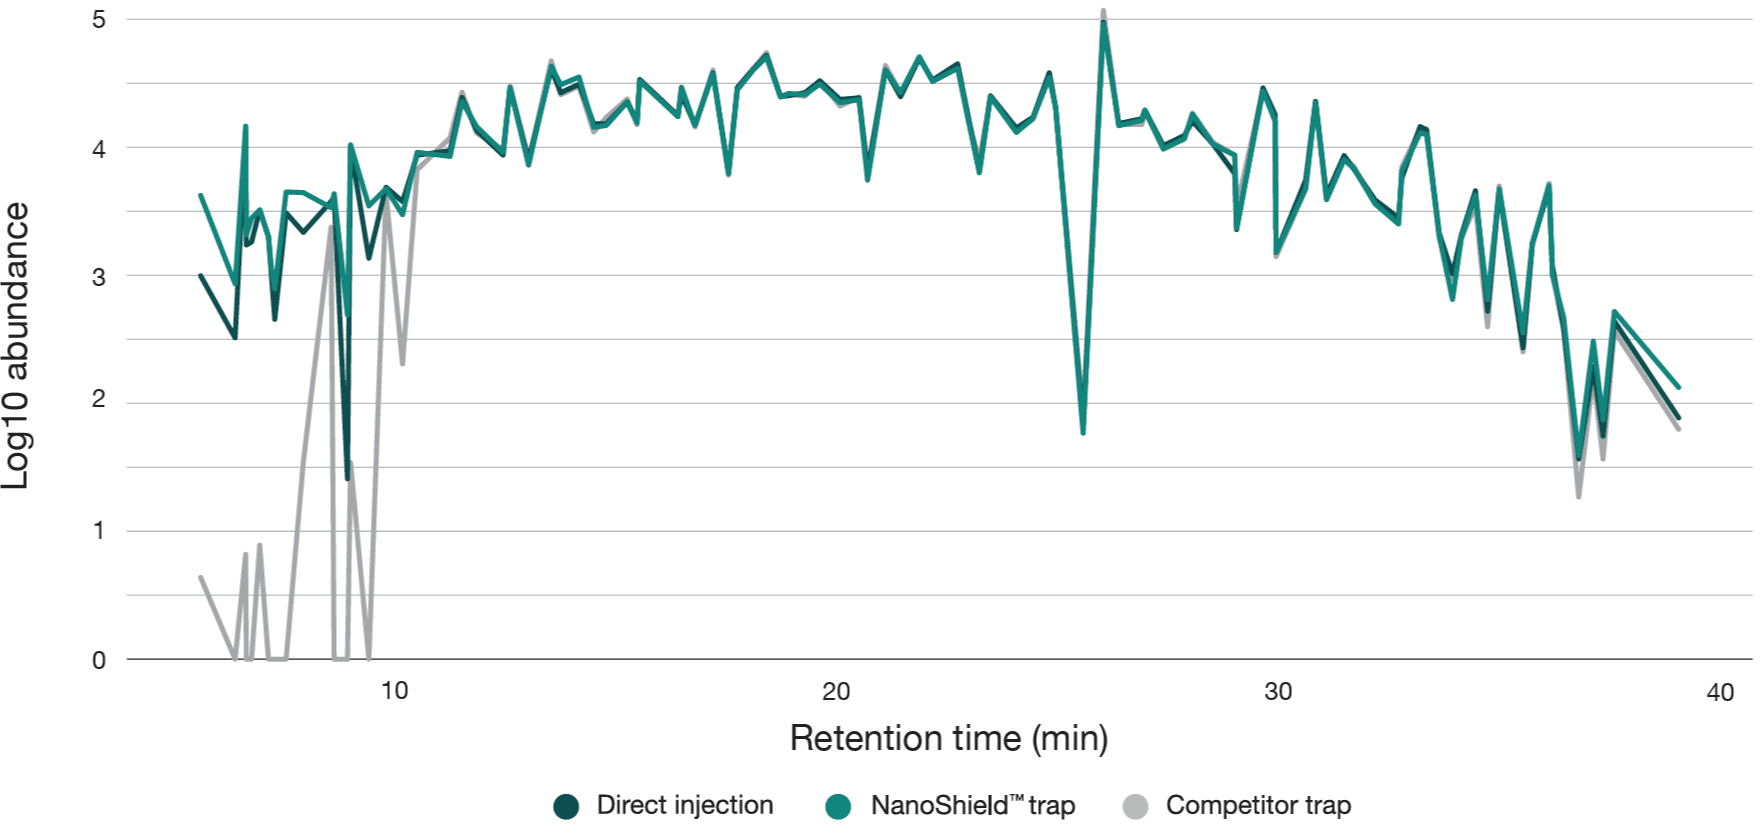
Figure 3: The NanoShield™ trap column provides superior peptide retention across the chromatographic gradient. Comparing direct injection against both NanoShield™ and a competitor C18 trap cartridgecoupled to an Aurora® Ultimate™ (25 cm × 75 μm) column, NanoShield™ trap columns fully retain early-eluting peptides, which are lost with the competitor trap cartridge.
Retention time stability
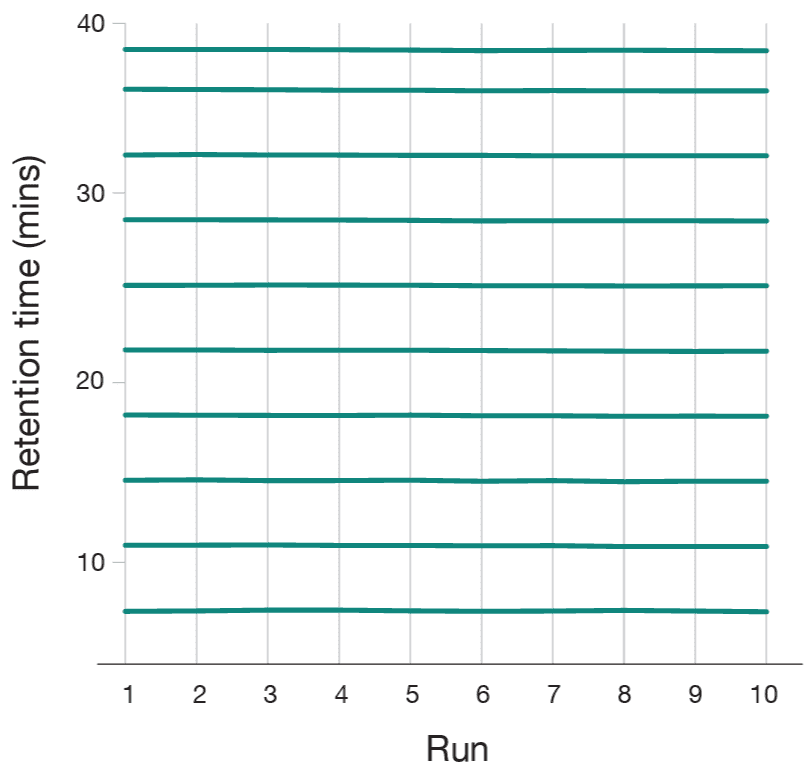
Figure 4: Retention time stability with NanoShield™ trap column for 10 peptides across 10 injections on an Aurora® Ultimate™ 25 cm x 75 μm column.
Different LC-MS? No problem.
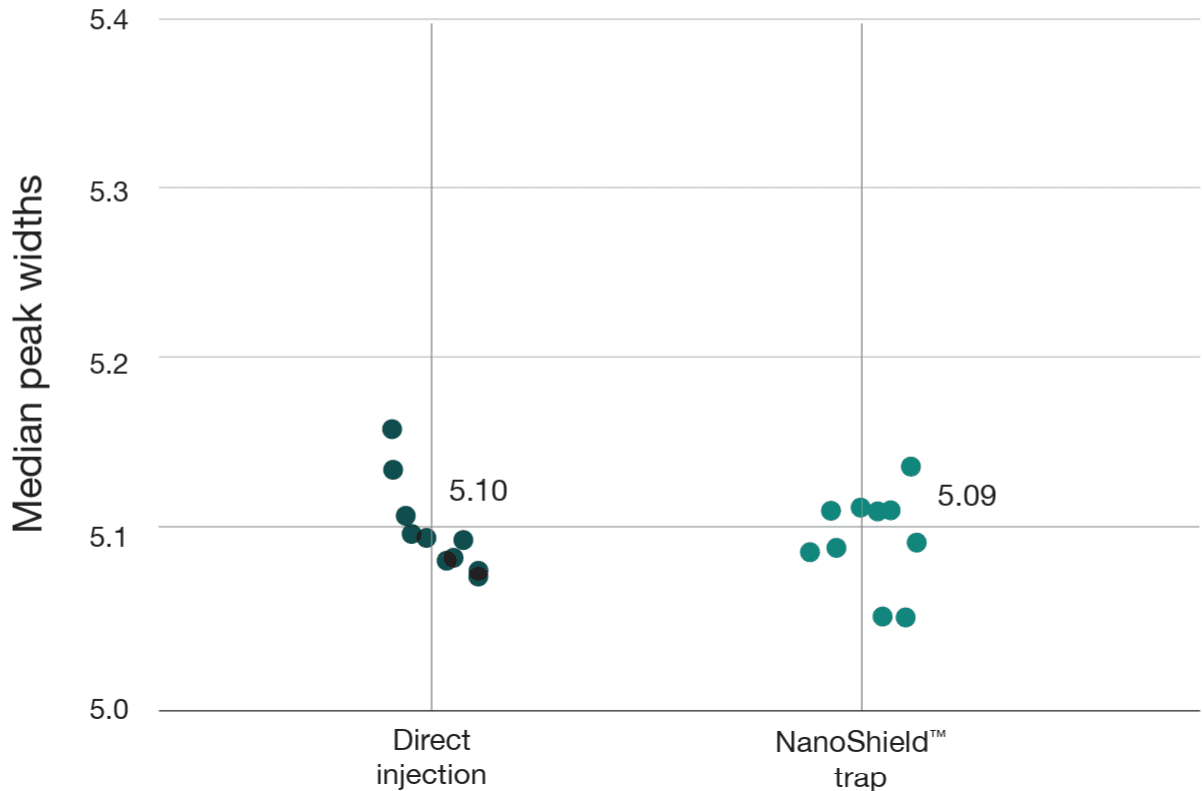
A 100 ng HeLa tryptic digest was analysed using a reverse-flush trap-elute method and compared to direct injection on a 40-minute gradient, employing an Aurora® Ultimate™ XT 25 cm × 75 μm on an UltiMate 3000 UHPLC coupled to a Thermo Scientific Orbitrap Fusion Lumos mass spectrometer. The NanoShield™ trap column (5 cm x 100 μm, 3 μm C18 particles) demonstrated near-direct injection performance across all metrics, showing less than 1% reduction in both protein and peptide identifications compared to direct injection (Figure 5). Peak quality metrics remained similarly robust, with no change in FWHM and a 2-4% decrease in peak shape ratios compared to direct injection. (Figure 6).
Unique peptide IDs
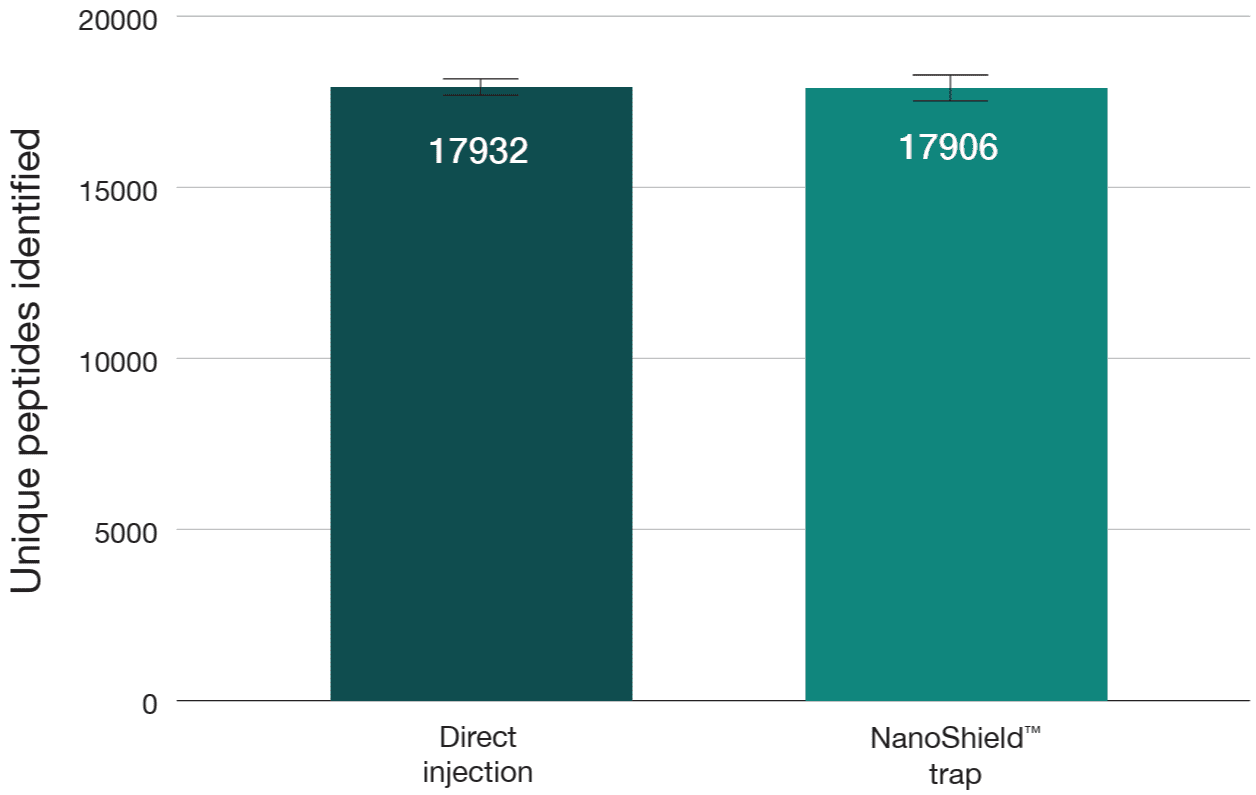
Unique protein IDs
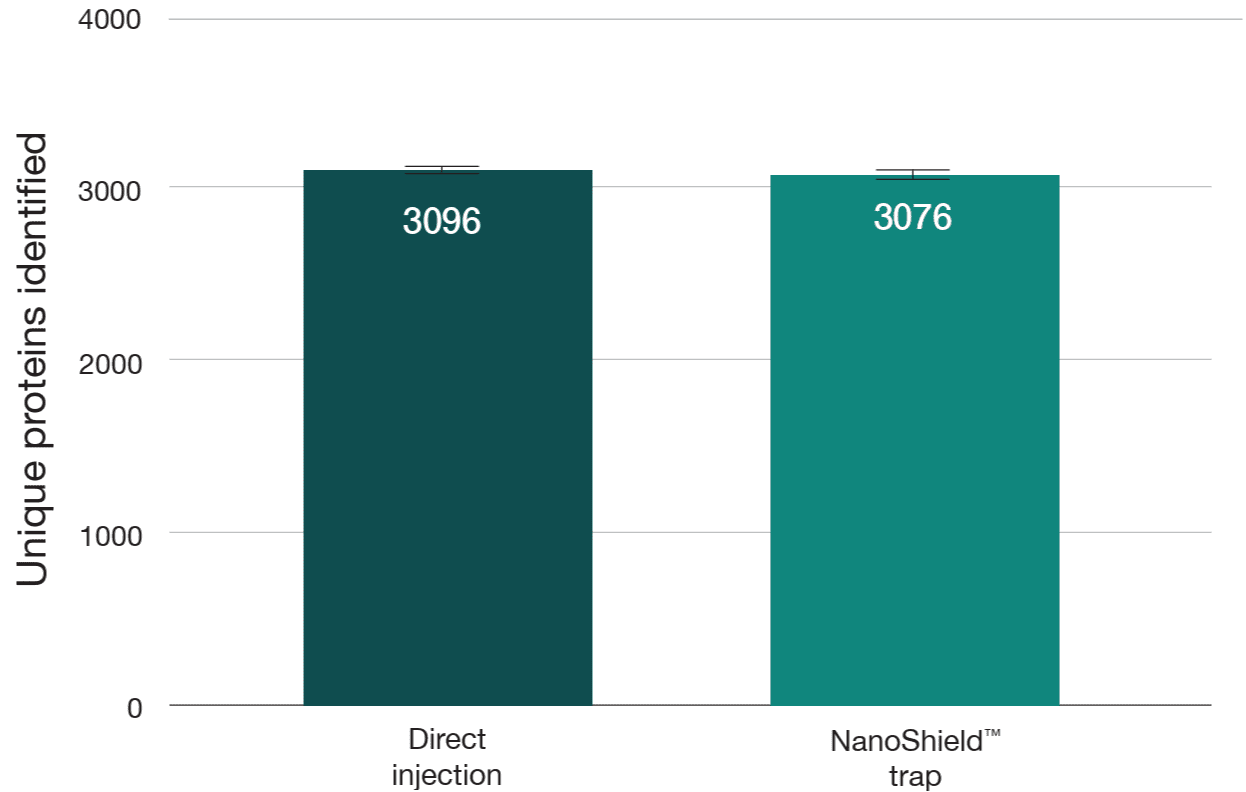
Figure 5: Unique peptide and protein identifications from 100 ng HeLa digest comparing direct injection to a NanoShield™ trap column on an Aurora® Ultimate™ XT 25cm x 75 μm column (40-min gradient). Raw DDA data was analysed using FragPipe (version 22.0) and MaxQuant (version 2.6.7.0).
Median peak width comparison
Median peak shape ratio comparison
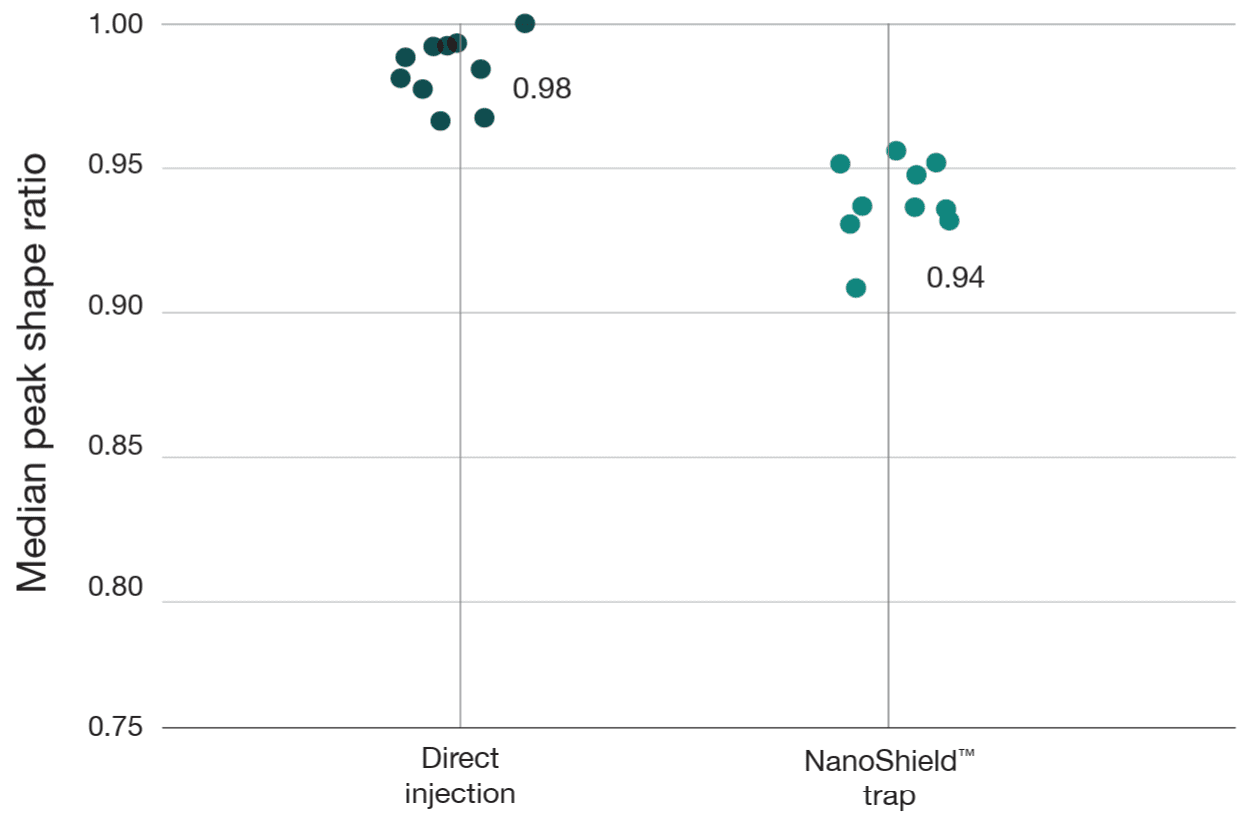
Figure 6: The NanoShield™ trap column preserves peak quality with minimal performance loss. FWHM and peak shape ratio comparisons for direct injection and NanoShield™ analysed on an Aurora Ultimate XT 25 cm x 75 μm column (40-min gradient). Raw DDA data was analysed using FragPipe (version 22.0) and MaxQuant (version 2.6.7.0). Each dot represents the analysis of an independent sample injection.
METHODS
LC-MS Analysis
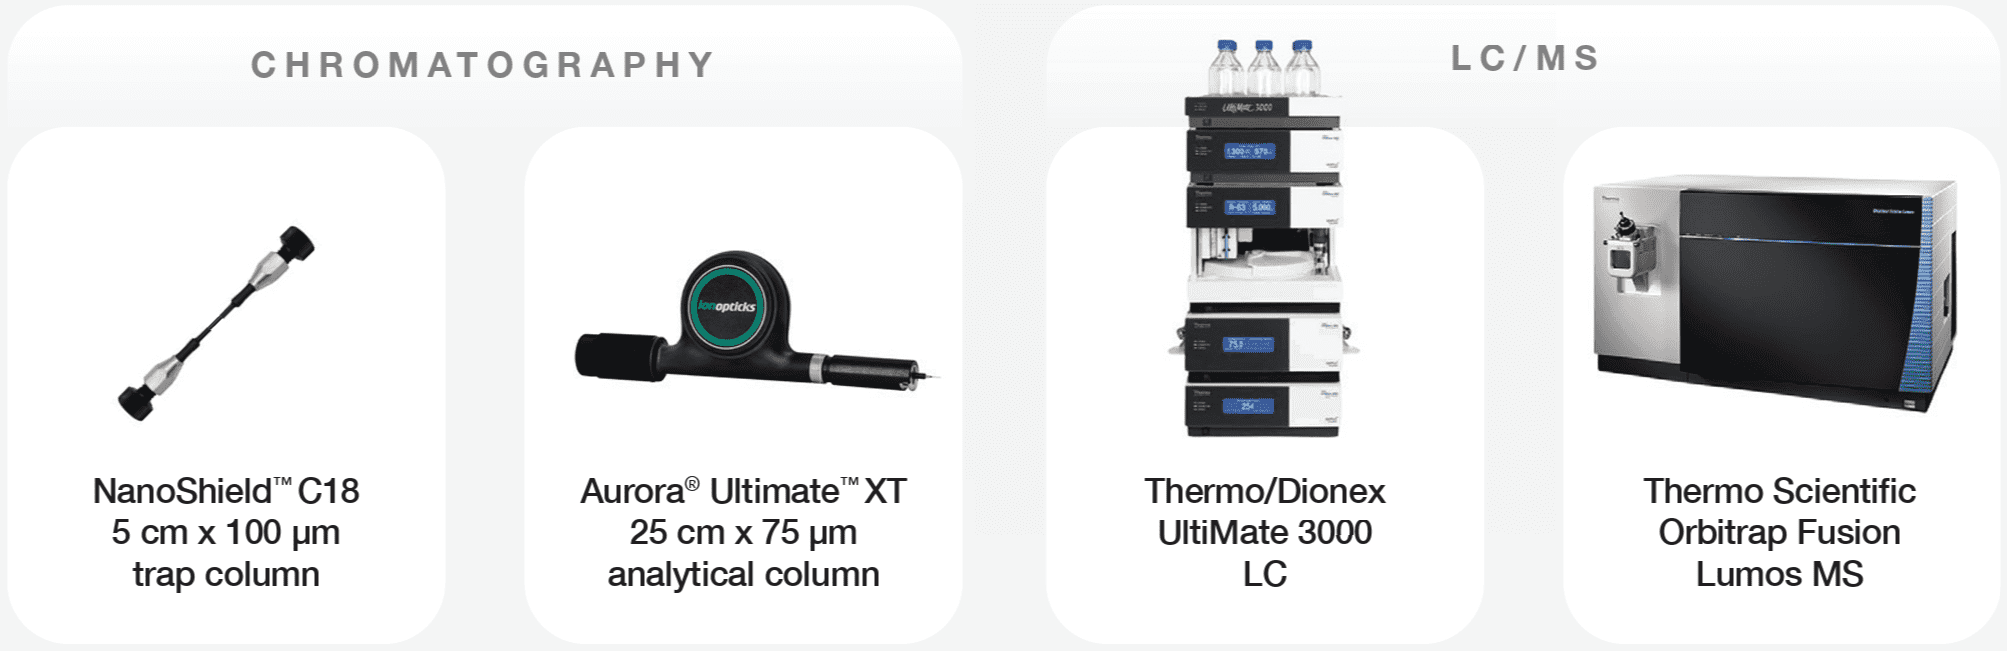
LC–MS/MS analyses were performed on a timsTOF HT mass spectrometer (Bruker Daltonics) coupled to a nanoElute 2 system, and on an Orbitrap Fusion Lumos mass spectrometer (Thermo Scientific) coupled to an UltiMate 3000 UHPLC. Peptides were separated using Rapid (8 cm × 75 µm, 1.7 µm C18 particles) CSI and Ultimate (25 cm × 75 µm, 1.7µm C18 particles) CSI analytical columns (IonOpticks) equipped with a CaptiveSpray source (Bruker Daltonics), as well as Ultimate (25 cm × 75 µm, 1.7 µm C18 particles) XT analytical columns equipped with a NanoSpray Flex source (Thermo Scientific) and NanoSpray Flex adapter (IonOpticks). All analytical columns were heated to 50 ºC. The Aurora XT column was heated using the HeatSync Heater Controller and column heater (IonOpticks), and the Aurora CSI columns were heated in the Bruker Column Toaster.
For trap-elute workflows, a NanoShield™ C18 trap column (5 cm × 100 µm, 3 µm C18 particles, IonOpticks) and a competitor C18 trap cartridge (5 mm × 300 µm, 5 µm C18 particles) were employed in a reverse-flush configuration. All traps were unheated over the valve at ambient temperatures. The mobile phases consisted of 0.1% formic acid (FA) in LC–MS-grade water (buffer A) and 0.1% FA in 99.9% acetonitrile (buffer B). For Rapid and Ultimate CSI columns, samples were loaded onto the trap column at 800 bar using two column volumes of buffer A. For Ultimate XT columns, samples were loaded onto the trap column with buffer A at a flow rate of 3 µL/min for 3 min. For Rapid CSI columns, peptides were separated using a gradient of 1–3% B (0–1 min) followed by 3–35% B (1–14 min) at a flow rate of 0.25 µL/min. For Ultimate CSI columns, the gradient was 1–3% B (0–1 min) followed by 3–35% B (1–37 min) at 0.4 µL/min.
For Ultimate XT columns, the gradient was 1% B (0–3 min), followed by 1–3% B (3–4 min) and 3–35% B (4–40 min) at 0.4 µL/min. For all column types, the mobile phase composition was maintained at 85% B for three column volumes to wash the column, followed by re-equilibration at 1% B for two column volumes.
For the timsTOF HT, data were acquired in dia-PASEF mode with an MS1 scan range of 100–1700 m/z. 21 isolation m/z and ion mobility (IM) windows were used for serial MS/MS fragmentation, covering 475-1000 m/z and 0.85–1.27 Vs/cm² 1/K₀ for the mass and IM ranges, respectively. For the Orbitrap Fusion Lumos, data were acquired in DDA mode with a full MS scan range of 350–1550 m/z, an MS1 resolution of 60,000, a cycle time of 1.5 s, an AGC target of 4e5, and an RF lens setting of 30%. Tandem mass spectra were collected in the ion trap with an intensity threshold of 2.5e4, a “rapid” ion trap scan rate, an isolation window of 1.6 m/z, and a normalised HCD collision energy of 30%.
All experiments were conducted using commercial HeLa digests, which are clean. In applications without prior sample clean-up, the trap is expected to improve performance by removing contaminants, such as salts from the tryptic digestion buffer, that can cause ion suppression during electrospray ionization.
Data Processing
DIA data were analyzed using Spectronaut (version 20.2). DDA data were processed with FragPipe (version 22.0) and MaxQuant (version 2.6.7.0). Further data processing and analysis were performed using R.
CONCLUSION
The NanoShield™ C18 trap column (5 cm × 100 μm, 3 µm C18 particles) sets a new performance standard for trap-based proteomic workflows by capturing hydrophilic peptides and delivering near-direct injection performance while providing the essential benefits of in-line sample clean-up, analyte focusing and rapid sample loading. Performance was validated across multiple LC-MS platforms: on the nanoElute 2-timsTOF HT system, NanoShield™ showed less than 1% reduction in protein identifications and 1–3% reduction in precursor identifications compared to direct injection, while on the Ultimate 3000 and Orbitrap Fusion cartridge (5 mm x 300 μm, 5 μm C18 particles). Lumos systems, less than 1% reduction in both proteins and precursors was observed. Across rapid (14-minute) and standard (~40 minute) gradients on Aurora® CSI and XT columns, the NanoShield™ maintained exceptional peak quality with minimal FWHM increases and substantially outperformed the competitor trap cartridge (5 mm x 300 μm, 5 μm C18 particles).
FURTHER READING
For further resources and technical support, visit our Help Centre at helpcentre.ionoptickscopy.com. To view other application notes, read the latest publications featuring Aurora Series columns, or view the full range of IonOpticks products, visit our website at www.ionoptickscopy.com
About IonOpticks
IonOpticks produces high-performance chromatography solutions for the global research community. We specialise in the development and manufacture of columns for analytical applications in liquid chromatography with mass spectrometry (LC-MS) and high-end proteomics. Our highly reproducible methods provide a unique ability to enhance the sensitivity of mass spectrometry sample analysis, enabling scientists and clinicians to discover more from their samples. Our team are experts in a broad array of LC-MS platform technologies and are driven by the need to improve chromatographic performance in order to achieve data quality and deep proteome coverage on a whole new scale.